The first step to solving a problem is to define the problem precisely. It is the heart of problem-solving.
Root cause analysis is the second important element of problem-solving in quality management. The reason is if you don't know what the problem is, you can never solve the exact problem that is hurting the quality.
Manufacturers have a variety of problem-solving tools at hand. However, they need to know when to use which tool in a manner that is appropriate for the situation. In this article, we discuss 7 tools including:
- The Ishikawa Fishbone Diagram (IFD)
- Pareto Chart
- 5 Whys
- Failure Mode and Effects Analysis (FMEA)
- Scatter Diagram
- Affinity Diagram
- Fault Tree Analysis (FTA)
1. The Ishikawa Fishbone Diagram IFD
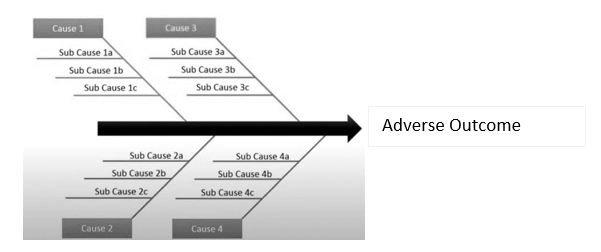
The model introduced by Ishikawa (also known as the fishbone diagram) is considered one of the most robust methods for conducting root cause analysis. This model uses the assessment of the 6Ms as a methodology for identifying the true or most probable root cause to determine corrective and preventive actions. The 6Ms include:
- Man
- Machine
- Methods
- Materials
- Measurement,
- Mother Nature- i.e., Environment
Related Training: Fishbone Diagramming
2. Pareto Chart
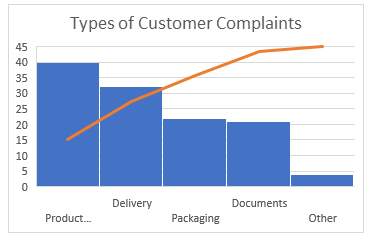
The Pareto Chart is a series of bars whose heights reflect the frequency or impact of problems. On the Chart, bars are arranged in descending order of height from left to right, which means the categories represented by the tall bars on the left are relatively more frequent than those on the right.
Related Training: EFFECTIVE INVESTIGATIONS AND CORRECTIVE ACTIONS (CAPA) Establishing and resolving the root causes of deviations, problems and failures
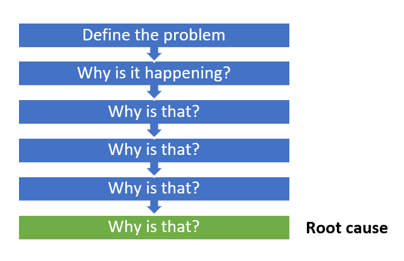
3. 5 Whys
This model uses the 5 Why by asking why 5 times to find the root cause of the problem. It generally takes five iterations of the questioning process to arrive at the root cause of the problem and that's why this model got its name as 5 Whys. But it is perfectly fine for a facilitator to ask less or more questions depending on the needs.
Related training: Accident/Incident Investigation and Root Cause Analysis
4. Failure Mode and Effects Analysis (FMEA)
| Process |
Failure |
Effect |
S |
Causes |
O |
D |
RPN |
| |
|
|
|
|
|
|
|
| |
|
|
|
|
|
|
|
| |
|
|
|
|
|
|
|
| |
|
|
|
|
|
|
|
FMEA is a technique used to identify process and product problems before they occur. It focuses on how and when a system will fail, not if it will fail. In this model, each failure mode is assessed for:
- Severity (S)
- Occurrence (O)
- Detection (D)
A combination of the three scores produces a risk priority number (RPN). The RPN is then provided a ranking system to prioritize which problem must gain more attention first.
Related Training: Failure Mode Effects Analysis
5. Scatter Diagram
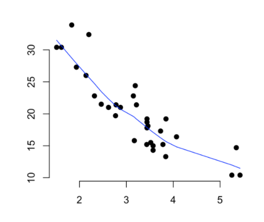
A scatter diagram also known as a scatter plot is a graph in which the values of two variables are plotted along two axes, the pattern of the resulting points revealing any correlation present.
To use scatter plots in root cause analysis, an independent variable or suspected cause is plotted on the x-axis and the dependent variable (the effect) is plotted on the y-axis. If the pattern reflects a clear curve or line, it means they are correlated. If required, more sophisticated correlation analyses can be continued.
Related Training: Excel Charting Basics - Produce Professional-Looking Excel Charts
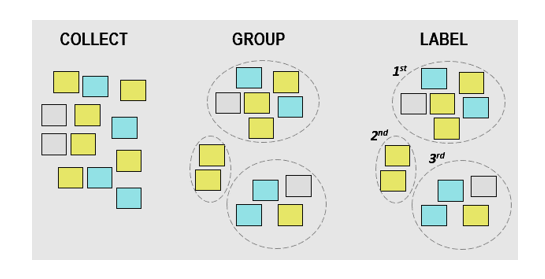
6. Affinity Diagram
Also known as KJ Diagram, this model is used to represent the structure of big and complex factors that impact a problem or a situation. It divides these factors into small classifications according to their similarity to assist in identifying the major causes of the problem.
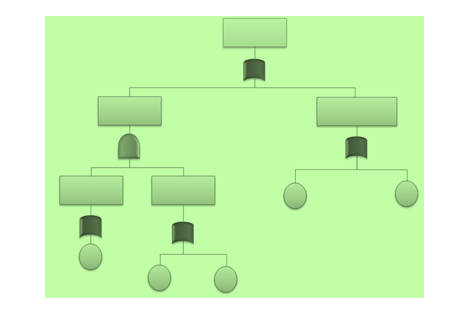
7. Fault Tree Analysis (FTA)
The Fault Tree Analysis uses Boolean logic to arrive at the cause of a problem. It begins with a defined problem and works backward to identify what factors contributed to the problem using a graphical representation called the Fault Tree. It takes a top-down approach starting with the problem and evaluating the factors that caused the problem.
Finding the root cause isn't an easy because there is not always one root cause. You may have to repeat your experiment several times to arrive at it to eliminate the encountered problem. Using a scientific approach to solving problem works. So, its important to learn the several problem-solving tools and techniques at your fingertips so you can use the ones appropriate for different situations.
Expert recommended Trainings on Root Cause Analysis
P&PC, SPC/6Sigma, Failure Investigation, Root Cause Analysis, PDCA, DMAIC, A3
This webinar will define what are the US FDA's expectation for Production and Process Control / Product Realization, the use of statistical tehniques, 6 sigma, SPC, for establishing, controlling , and verifying the acceptability of process capability and product characteristics, product acceptance or validation and other studies. Non-conformance, OOS, deviations Failure Investigations, and Root Cause Analysis, PDCA, DMAIC, and similar project drivers to improvement, A# and similar dash boards.
Accident/Incident Investigation and Root Cause Analysis
If a major workplace injury or illness occurred, what would you do? How would you properly investigate it? What could be done to prevent it from happening again? A properly executed accident/incident investigation drives to the root causes of the workplace accident to prevent a repeat occurrence. A good accident/incident investigation process includes identifying the investigation team, establishing/reviewing written procedures, identifying root causes and tracking of all safety hazards found to completion.
Root Cause Analysis - The Heart of Corrective Action
This presentation will explain the importance of root cause analysis and how it fits into an effective corrective and preventive action system. It will cover where else in your quality management system root cause analysis can be used and will give examples of some of the techniques for doing an effective root cause analysis. Attendees will learn how root cause analysis can be used in process control.
Usability Principles for Medical Devices: Interpreting and Implementing IEC 62366
This webinar will provide valuable guidance to regulated companies in development and implementation of Use Engineering / Human Factors Engineering using the 9 stage model in IEC 62366-1. IEC 62366-2 on recommended implementation considerations will be briefly considered, with the focus on IEC 62366-1, the basic methodology. the webinar willshow when and how these tools are incorporated into R&D design control, risk management, validation, root cause analysis, CAPA / falure investigations, GMP auditing, and liability reduction.
Addressing Non-Conformances using Root Cause Analysis (RCA)
RCA assumes that systems and events are interrelated. An action in one area triggers an action in another, and another, and so on. By tracing back these actions, you can discover where the issue started and how it grew into the problem you're now facing.
Supervising a Human Error Free Environment: You can do a Lot More than you Think
This training would provide tools that can be implemented and used after this event. This includes practical tools. We will discuss why supervision is so important in reducing and preventing human error. Supervision approaches near root causes and root causes for supervision related errors and will address the main five elements to assure an error-free environment.
Powerful Closed-loop CAPA - Meeting FDA Expectations
This 90-minute webinar will show how you can implement a closed-loop CAPA system that meets CGMP requirements and U.S. FDA expectations. You will learn simple, but powerful, tools and methods that you can use regularly and systematically to define and resolve root causes, not just symptoms.
Human Error Investigations, Root Cause Determination and CAPA Effectiveness
This training program will offer attendees an understanding of human error, its factors and causes. The program will also identify the regulatory and business importance of human error prevention and define the process to manage human error deviations.
Risk Management Under ISO 14971
ISO 14971:2019 is the definitive standard for risk management for medical devices and IVDs. The standard lays out a comprehensive approach to managing risks in the life sciences. The course will discuss practical approaches to complying with the standard.
Corrective and Preventive Action; Our Most Important Quality Process
Corrective and preventive action (CAPA) is a process of the quality management system that begins with the identification of a problem (or opportunity), goes through a series of steps including identification of the root causes and deployment and verification of a solution, and documentation and deployment of lessons learned. The deliverables include not only elimination of the problem at hand, or realization of the opportunity, but application of the best practices learned to related activities.
Human Error Reduction in GMP Manufacturing
This training program will offer attendees an understanding of human errors in GMP related environments, factors and causes, and control measures to be put in place to reduce the same.
Human Error Reduction Techniques for Floor Supervisors
Attend this course to gain practical approaches for supervision on the floor, strategies to get your group in sync and approach issues in GMP related environments by using a specific methodology to correct, prevent and avoid re-occurrence of these issues.
Introduction to Root Cause Investigation for CAPA
If you have reoccurring problems showing up in your quality systems, your CAPA system is not effective and you have not performed an in-depth root cause analysis to be able to detect through proper problem solving tools and quality data sources, the true root cause of your problem. Unless you can get to the true root cause of a failure, nonconformity, defect or other undesirable situation, your CAPA system will not be successful.
How To Implement An Effective Human Error Reduction Program
Attend this training to learn how to implement a Human Error Reduction Program at your site. It includes practical tools and explains how to measure effectiveness to continuously improve human reliability at your site.
Mastering CAPA: A Stepwise and Sustainable System
This webinar covers the central role of CAPA for the FDA, challenges in building an effective CAPA system, gives a comprehensive understanding of a CAPA process which is highly effective and sustainable, becoming a tool for continuous improvement.
Root Cause Analysis and CAPA Controls for a Compliant Quality System
In this CAPA webinar, learn various regulations governing Corrective and Preventive Actions (CAPA) and how organization should collect information, analyze information, identify, investigate product and quality problems, and take appropriate and effective corrective and/or preventive action to prevent their recurrence.
How to Design and Implement a Dynamic Control Plan
This webinar training will discuss how to design a dynamic control plan that combines FMEA and the control plan by extending the FMEA to encompass the elements of the control plan and create a living document that helps to drive continual improvement.
How to Build and Use a Risk Bow Tie
This training program will define and discuss the bowtie risk assessment method used to analyze and establish causal relationships in high risk scenarios. Named after the shape of the diagram created, bowties provide an excellent visual representation of the potential causes and consequences of a risk scenario and help ensure that all relevant information is identified and properly assessed.
Process Reliability Modeling: Measure the Cause Not the Effect of Process Variations
This webinar will discuss in detail Process Reliability Modeling (PRM) method including its history, the process, validation, and results of effective management, sigma score and customer satisfaction. Attendees will learn how to convert qualitative information into quantitative data to determine process and system reliability.
You have a BI or Sterility Failure - Now What?
This webinar on sterility or bioburden test for medical devices will discuss about the various items that should be investigated to determine the root cause, when a failure occurs during a sterility test, and the follow up to the investigation.
Precision Tools for Error Reduction: Strategies and Implementation Techniques
This training program will analyze the factors and causes behind human errors. It will define the process to manage human error deviations and participants will learn about human error measurement. The program will also discuss tools for measurement and Key Performance Indicators (KPIs).
Effective Deviation Investigators Under GMP
This 120 minute training course will help attendees understand the fundamental steps of a deviation investigation with focus on using facts and objective evidence to arrive at root cause and CAPA. Learn how to identify and avoid potential pitfalls during deviation investigations.
Prevent Accidents: Root Causes, Investigation and Avoidance Plans
This webinar training program will discuss how to develop an accident investigation plan, manage cost, and develop realistic schedule. Participants will learn about the interview process, protecting site of incident, determining root cause, and avoidance plan.
An Easy to Implement Integrated Risk Management Approach Compliant with ISO 14971
This integrated risk management training for medical devices will discuss how to incorporate risk management as per ISO 14971 guidelines in all phases of medical device development. It will highlight the documentation needed to support the decisions made as part of the risk management process.
Legal Disclaimer
This piece of content and any of its enclosures, attachments or appendices, references are created to provide solely for information purpose. ComplianceOnline has made all effort to provide accurate information concerning the subject matter covered. This content is created from interpretation, and understanding of relevant and applicable information and it is not all inclusive. It can be best used in conjunction with your professional judgment and discretion.
However, this piece of content and any other ancillary items disseminated in connection with same are not necessarily prepared by a person licensed to practice law in a particular jurisdiction. This piece of content is not a substitute for the advice of an attorney. If you require legal or other expert advice, you should seek the services of a competent attorney or other professional.
ComplianceOnline necessarily is not, cannot and will not be liable for any claims, damages, or regulatory legal proceedings initiated as a consequence of you using whole or any part of the content present in this document. If any action, claim for damages, or regulatory proceedings is commenced against ComplianceOnline as a consequence of your use of this document, then and in that event, you agree to indemnify ComplianceOnline for such claims, and for any attorney's fees expended by ComplianceOnline in connection with defense of same.