The Fundamentals of Statistics for Quality Improvement
In business, decisions need to be taken based on data. Statistical thinking guides decision making based on the analysis of data. Many companies have a lot of data but don't know to turn their data into useful and actionable information. However, companies that make the best use of their available data achieve a competitive advantage by optimizing their operations and making superior decisions. It is all the more imperative for quality professionals to examine the best practices in statics for quality engineering to improve the performance of their current system.

To focus on continual improvement, companies must make a shift from control-oriented management to statistical quality control. They must emphasize statistics rather than application. They must collect data and make faster decisions based on data
This article explains the basics of statistics and statistical methods for quality improvement to help you make substantive decisions.
The statistical fundamentals
Statistics are tools that help in analyzing data, making summaries, drawing inferences, and generalizing from the data. Statistics are highly crucial in the field of quality. Learning how to develop different statistical charts and statistical techniques is crucial. However, learning how to apply those techniques in a way that will document and stimulate continual improvement of the organization is even more important.
Central to quality improvement is statistical thinking. Statistical thinking is a skill that is displayed by the ability to make decisions based on data. Such thinking is based on three concepts as shown in the figure below:
Three concepts of statistical thinking
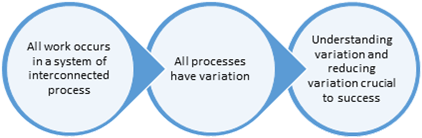
Process variation
All processes display variation. There is some variation that can be controlled and others that cannot be controlled. If the variation is too high, the process parts will not fit in properly, the product will be defective, and the company's reputation for quality will be at stake if corrective actions are not taken.
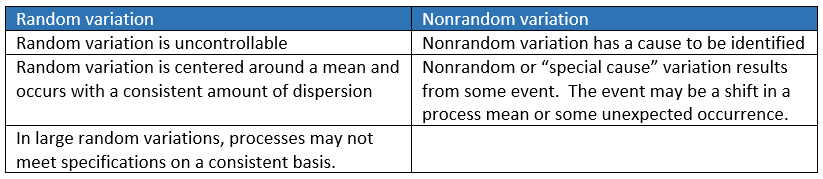
There are two types of variations that occur commonly viz. random and nonrandom variation.
Process stability
When a process performs consistently over time, then the process is considered to be stable or in control. Process stability refers to the steadiness of the process with regard to critical process characteristics such as the average value of a key dimension or the variation in that key dimension.
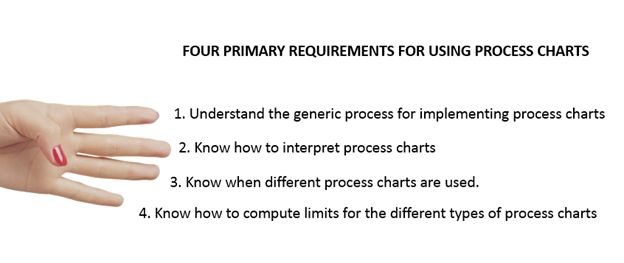
The process stability is determined by using process charts. Process charts are charts that signal the process personnel when a nonrandom variation occurs in a process.
Sampling methods
Data are gathered in samples to ensure the stability of the process. Sampling methods are preferred and are better established because they are cost-effective, less intrusive, fast, and their destructive testing features. They also let the user frame the sample.
- Random sampling: Randomization ensures independence among observations.
- Systematic samples: Systematic samples according to time or according to sequence
- Sampling by Rational Subgroup: a group of data that is logically homogenous; variation within the data can provide a measure for setting limits on the standard variation between subgroups.
Considerations for Planning for inspection
- The type of sampling
- The personnel who will sample
- The persons for the use in-process inspection sample size
- The critical attributes to be inspected
- The location for the inspection
Process control charts
Process control chart definition
"A control chart is a statistical tool used to distinguish between variation in a process resulting from common causes and variation resulting from special causes. It presents a graphic display of process stability or instability over time." (Air University)
The main purpose of a process control chart is to indicate when production processes might have changed sufficiently to affect product quality. If the chart shows that the quality of the product has deteriorated, it is an indication to take corrective actions.
General guidelines for developing process charts
- Identify critical operations in the process where inspection might be needed.
- Identify critical product characteristics.
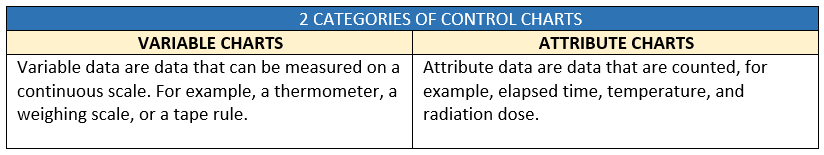
- Determine whether the critical product aspect is variable or attributable
- Choose the relevant process control chart from the many options available
- Determine and establish control limits and use a chart for ongoing monitoring and improvement.
- When you make changes to the process, update the limits
Process stability and capability
When a process is stabilized, the immediate next step is to ensure the process is capable. Process capability is the ability of the process to produce the desired product. The six sigma is one such program that results in highly capable processes.
Capability studies are conducted for two reasons:
- To determine whether a process results in the product that meets the specifications
- To determine whether a process is in need of monitoring through the use of permanent process charts.
There are many forms used in the statistical methods for quality improvement:
Hypothesis testing: A statistical method for making statistical decisions using experimental data. Hypothesis Testing is basically an assumption that can be made about the population criteria.
Regression analysis: A study to understand the relationship between two or more variables.
Statistical process control: An industry-standard methodology for measuring and controlling quality during the manufacturing process.
Design and analysis experiments: Planning, directing, examining and interpreting controlled tests to evaluate the factors that may influence a response variable.
Why some companies fail with statistics
- Many companies fail to develop statistical thinking and culture.
- They fail to implement quality control in a substantive way and prefer form over substance.
- Some lack the knowledge about statistical tools, and so misapply them.
- Others have a general disdain for all things mathematics creates and that creates a barrier to the use of statistics.
- Cultural differences in a company sometimes make the use of statistics for quality improvement a bottleneck.
- Statistical experts find it difficult to communicate with managerial generalists.
- Lack of understanding of statistical methods
- Lack of proper education in statistics
- Lack of patience in collecting data
- Fear of violating critical statistical assumptions
- Some people don't understand random variation
FAQs on Statistics for Quality Improvement
1. What is "statistical thinking" and why is it important for quality improvement?
Statistical thinking means using data, variation and process behavior to drive decisions—not just gut-feels. According to the article, true quality improvement happens when you shift from “just control” to thinking in terms of variation, data and continual improvement.
In practice: start looking at your process data, ask “what’s the variation?”, “what’s stable?”, and “how can we use this to improve?” rather than just inspecting defects after the fact.
2. What kinds of process variation should I worry about?
There are two main types of variation: common-cause (natural variation in a process) and special-cause (unexpected variation from an assignable source). The article explains that recognising the difference is key because treating the wrong type of variation can lead to misguided actions.
Humanly: If your machine normally has a small variation and then something huge happens (special-cause) you act differently than if the variation is just part of normal everyday noise (common-cause).
3. What is a control chart and how does it help?
A control chart is a statistical tool that shows whether a process is stable (in-control) or if something unusual is happening (out-of-control). The article says it “presents a graphic display of process stability or instability over time.”
In simpler terms: imagine a line chart of your process metric and two boundary lines. If the measurement stays within those lines reliably, you’re stable. If it jumps out, you investigate. It helps you act before defects pile up.
4. How does sampling work and why is it preferred in many quality contexts?
The article highlights sampling methods because collecting full data for every item can be costly, intrusive or impractical.
In plain language: instead of inspecting every widget coming off the line, you pick a representative slice (random, systematic or rational subgroup) and check that. If the sample is good, you infer the process is likely fine; if not, you investigate.
5. Can statistical methods really help companies that already have lots of data?
Yes — the article emphasises that many companies have data but don’t know how to turn it into useful information. Statistical thinking and methods help bridge that gap.
In practical terms: you might have production logs, inspection results, process sensors — but unless you organise and analyse them (for variation, stability, capability) you won’t get beyond “we’ve got data” to “we’re improving”.
6. What are common reasons companies fail when applying statistics to quality improvement?
Good question — the article lists several pitfalls: lack of statistical thinking/culture, misapplication of tools, impatience with data collection/analysis, fear of assumptions, etc.
In everyday language: if your team sees statistics as just “boring math” or “extra work”, or you apply tools blindly without understanding what they mean, you’ll struggle. You need buy-in, training, patience, and good questions.
7. After stabilising a process, what’s the next step?
Once a process is stable, you check capability—i.e., can it reliably meet specification? The article explains that a stable but incapable process still creates problems.
Simply: Stability = consistent. Capability = good enough. Both matter. If your process is consistent but always off spec, being stable doesn’t help; you must adjust process or spec.